The National Assessment of Academic Progress (NAEP) recently released the Nation’s Report Card for the 2021–2022 school year, and the results are concerning. In just one example, this assessment reveals the biggest drop in math scores among students in grades 4 and 8 since the NAEP began.
The NAEP is a national sample with a long history. It has remained constant in terms of scale and difficulty since 1969, so it’s one of the best and most reliable sources for longitudinal data about student performance. It is also the only such test administered to students in all 50 states.
However, because of its design and the fact that it only comes out every other year, the NAEP can tell only part of the story. The most recent NAEP assessments were administered in March, and student progress tends to slow down during the second half of most school years—but in 2022 we found that student work continued to grow very solidly throughout the spring, meaning that students’ performance continued to evolve after NAEP’s snapshot was taken.
More from DA: How you can learn to lead a staff that’s facing burnout
In other words, the NAEP data is important—and those declines in math scores are real and concerning—but it’s only part of the picture. The “How Kids Are Performing” report (HKAP) is wider in scope and larger in sample size than NAEP, and the most recent version suggests some reasons for hope.
Over the course of the 2021–2022 school year, for example, kindergartners exceeded typical growth, including a 12-point increase in their literacy growth. Reading growth in grades 1–4 also met or exceeded 50, the standard for student growth percentile (SGP) in a typical year. Even in math, where scores took a larger hit than reading over the course of the pandemic, last year had some bright spots.
Scores rebounded across subjects and demographic groups
Math scores fell primarily because, I believe, math is so relentlessly cumulative. Students who missed a bit of math instruction were generally less able to continue their learning than students who missed a particular concept in their English language arts classes. It’s likely that those students also had some holes in their math knowledge before the pandemic, and those gaps only grew as students’ learning was disrupted.
FETC 2023
The Future of Education Technology® Conference takes place live and in-person Jan. 23-26, 2023, in New Orleans. Register now!
But math scores also had larger rebounds than reading scores. Students have recovered so well in math, in fact, that the average SGPs in the latest HKAP report are pretty typical, ranging from 47 to 55.
Still, it’s important to note that SGPs are a measure of growth rather than a measure of proficiency. For students to return to typical achievement levels, they will need to string together multiple years of SPGs greater than 50.
The HKAP data doesn’t explain why math rebounded more strongly than reading, but a likely explanation is that educators saw the data demonstrating that math was an area of great concern, so they focused their efforts there—and achieved some significant success. Those rebounds, which were concentrated in the elementary grades, are excellent news for young students and their teachers and administrators. Math does remain an area of concern for high school students, particularly because there is much less time to help those students catch up before they go on to college or careers.
Reading and early literacy may not have rebounded as strongly as math so far, but on average SGPs appear to be on the upswing here as well. The mean SGP across all grades was just a bit below average, at 48, which is three points higher than in the 2020–2021 school year. The following table from the latest HKAP report illustrates these findings:
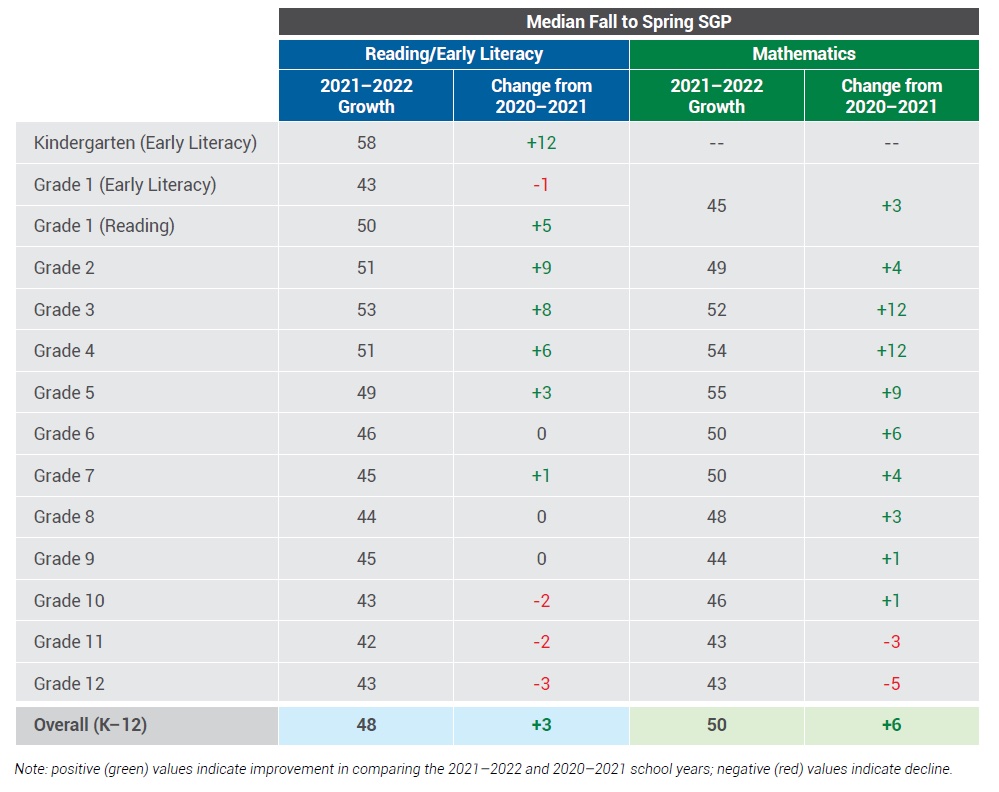
(Source: How Kids Are Performing 2021–2022)
Among demographic groups, the trend, again, is generally positive. Though SGPs are lower than I’d like, ranging from 42 to 51, every group except Catholic school and other private school students—who still ended up with an average SGP of 51—saw higher SGPs than in the 2020–2021 school year. Black students had the lowest SGP, at 42, but they also saw an eight-point increase—the greatest increase of any group over the previous school year.
Maintaining the momentum in 2023
There is still a lot of work to do, but it’s important to keep in perspective the significant progress educators have already made. It was not that long ago that all our lives suddenly and traumatically became very different. While the pandemic made teaching and learning immensely more difficult overnight, helping students recover will take more time. There was work to do in so many areas—both academically, across all subjects, and social-emotionally. It’s as if educators and students are engaged in a game of “Whac-A-Mole,” and they have only one hammer to knock down all these moles. It will take some time.
The good news is that educators across the country seem to be paying attention to the data identifying areas of greatest concern, they are taking action, and it is all having a positive impact on students.